Excel dashboard · demo project, fictional brand
Sales and cash dashboard in Excel
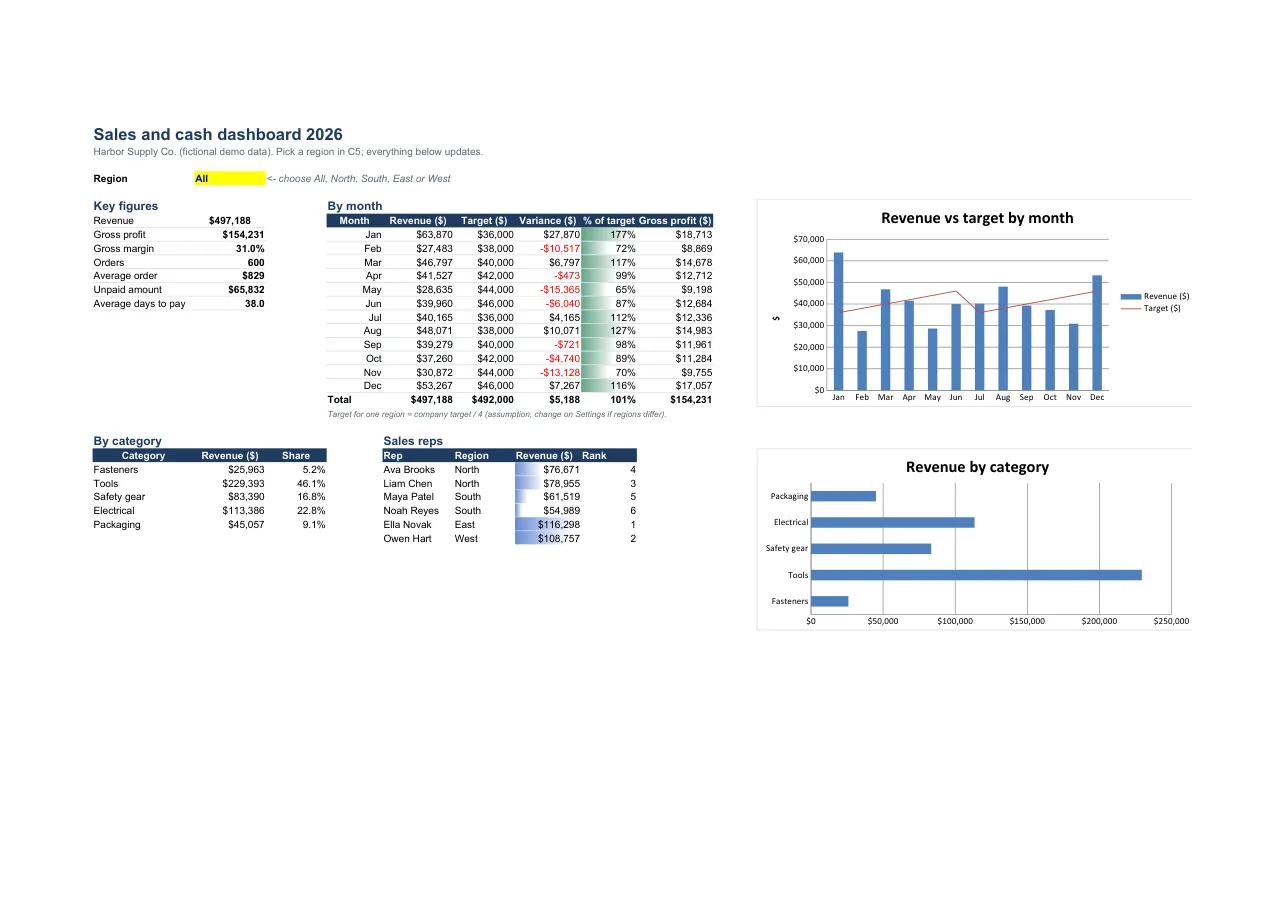
A one-page Excel dashboard for a small distributor: pick a region and every figure, table and chart follows.
The problem
Owners copy numbers between sheets every month and still cannot see which month or rep is behind. Here the raw orders go in one table and the dashboard does the rest.
What I built
- Orders table with revenue, cost and gross profit as formulas; margins and monthly targets on a separate settings sheet (blue input cells).
- Region drop-down that drives key figures, a month-by-month table against target (shortfalls in red, % bars), category share and a sales-rep ranking.
- Two charts and a one-page landscape print layout; a read-me sheet with how to use and the assumptions.
How it was tested
- 2,506 formulas recalculated with zero errors.
- Every dashboard figure equals an independent calculation in Python (pandas) from the same 600 orders, for all regions and for one region.
Screens and video
Downloads
Built with: Excel (works in Google Sheets and LibreOffice): SUMPRODUCT, INDEX/MATCH, data validation, charts
Need something like this for your business?Hire me on Upwork